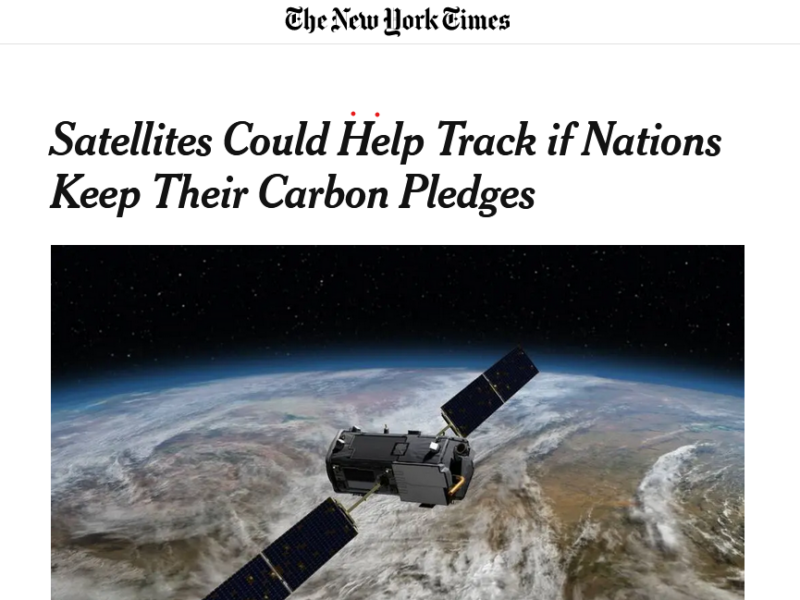
Planetary Boundaries Modeling

Together with the Stockholm Resilience Center, I visualized the global environmental limits in which human development can strive and visualizing the connections between those limits.
Showing the global environmental limits in which human development can strive and visualizing the connections between those limits
  • Greenhouse Gas Emissions
    Interactive visualization published with The Guardian that show the past, present, and future of carbon dioxide emission.
  • Data Visualizations
    Interactive visualizations that show clear insights from complex data on global emissions and the history of climate change.
  • Power Explorer
    The first global open data base of power plants to help citizens, companies, and investors track their climate, water, and air pollution impacts.

Leave a Reply

Your email address will not be published.