Uncategorized

Party Button 1.0
150 150 johannes

How about a button that can spawn an instant dance party in your living room?

Introducing the Party Button 1.0.

Party Button

While the idea is not new, this tutorial shows how to build a party button for cheap ($50 or less). If configured right (it is quite extensible) it turns your living room into a dance party with the push of a (wireless) big red button. The inspiration came from a scene in Parks and Recreation and the details were inspired by the Emergency Party Button (which in comparison costs $500). This Party Button is not only affordable, but allows you to scale it up by utilizing Android apps, Amazon Dash Buttons and any smart devices that you can connect to your phone.

Let dive into it.

UPDATE 2020: Amazon has killed the Dash Buttons used in this party button. You might still find them on Ebay, but I am not sure if the hack I am presenting here is still working. Here is also a guide I found to build a party button with Raspberry Pi: https://www.ratherdisturbing.co.uk/epb/

What do you need?

  1. Smart devices to control the lights (as many as you want), for example
    1. WeMo smart plug ($26)
    2. Cheaper smart plug ($9)
    3. Disco light ($12) or similar that is controlled with the smart plugs
    4. Smart bulbs ($9)
  2. Android phone with the following apps
    1. Tasker – automation app to control the music and IFTTT
    2. Notification listener to make the connection to the button
    3. IFTTT to control smart devices not compatible with Tasker
  3. Amazon Dash Button ($5) – UPDATE: Not available on Amazon anymore. You can buy one on Ebay, but have not tested if they still work. Raspberry Pi is and alternative.
  4. Big red button ($18.99)
  5. Spotify (with subscription)
  6. Roku Express ($30) optional, depends on your setup
  7. A cat (optional)

Party Button Cat

The minimal costs for me to set it up was about $26.

A fancier setup with more devices could be around $50-$100.

The Flow from Button Press to Party

In my research I found that a combination of the above hardware and software allows for the cheapest, most flexible solution. Feel free to comment if you have suggestions for improvements.

Overall the flow of the Party Button 1.0 is listed below. Some steps can be made even more automated if you want to invest more $ in smart bulbs or smart plugs.

This setup for my house relies on Spotify playing on your speakers or and in my specific cases have Spotify run on a Roku connected to my speakers. If you have your phone connected directly to a Bluetooth sound system the setup is actually a bit easier as you don’t have to send API calls to the Roku.

Sequence flow of the party button:

  1. Turn off all lights in the house (in my case done manual, could be automated with more smart devices)
  2. Push the Party Button (manual, duh)
  3. Amazon Dash Button in the Party Button sends notification to my phone via WiFi (takes about 5 seconds)
  4. Amazon app throws notification that Dash Button needs to be setup
  5. Notification Listener identifies notification and starts Tasker App chain
  6. Tasker starts its action based on your configuration, in my case
    1. Authenticate with Spotify
    2. Turn down the volume on Spotify
    3. Turn on smart bulb
    4. Send Roku signal to start playing Spotify party song (about 5 seconds)
    5. Turn down volume 1% when song starts
    6. Cycle through some effects until the beat drops
      1. Wait 4 seconds
      2. Turn off/on bulb for some anticipation
      3. Turn volume up step by step
    7. Turn on Wemo Smart Plug that have the disco lights connected
    8. Turn volume 100%
    9. Wait until song end (3:10 seconds)
    10. Turn off Wemo
    11. Turn off bulb
    12. Turn down volume
    13. Play chill song

So that’s the main setup.

In the next sections I will describe the setup of each of the major parts.

The Button

The button makes the setup look great. It’s big, red and wireless.

I found a big button on Amazon (Update: Not available anymore, but there are others)  that we can turn into a wifi button by combining it with an Amazon Dash Button. The setup is simple:

  1. Unscrew the red button
  2. Put some spacer in the side of the button casing. I used cardboard that I wrapped in MacGyver tape.
  3. Tape the Dash Button on top of the space in a way that the moving parts of the big button are triggering the Dash Button. You don’t need to give it lots of space as the cardboard spacer is flexible and can be squished a bit.
  4. Close the whole thing up
  5. Tape some description on the outside and a Party Button sign on the front. I printed these slides if you want to reuse them

Party Button Build

As a bonus, the buttons will make a sound and light up. That should be it for the button. Easy, right?

The Smart Devices

For my setup, I only used two smart devices (one smart bulb and one Wemo smart plug) and already produces nice results

Wemo

  1. Connected through the official Wemo App, can be controlled with IFTTT. See the description in the respective app on how that works
  2. Connected an extension cord with a black light and a disco light

Smart bulb

  1. Cheap option from China, works with the Smart Life app and can also be controlled with IFTTT. See the description in the respective app on how that works
  2. I set this one on rapid color change just to get some light action started while the other steps are running and people are waiting for the beat to drop

This setup can be extended indefinitely with more smart devices that can control all kind of things.

The Android Setup

Setting up your Android phone with the right apps and code will take a bit of time. I will provide some of the Tasker configuration files for you to start, but there are some steps you have to do (at least once) yourself.

The steps that you need to go through to have Tasker control the events are roughly:

  1. Step 1: Install Tasker & IFTTT
  2. Step 2: Setup Spotify control
  3. Step 4: Setup Roku control
  4. Step 5: Trigger IFTTT from Tasker
  5. Step 7: Grab the notification from Amazon Dash Button

Install Tasker & IFTTT

First you have to install Tasker which we use to control the whole action chain.

You will also need to install IFTTT (IF This Then That) as Tasker cannot easily control smart devices. So we will need to trigger IFTTT from Tasker, which will in turn control your smart devices. But more to that later.

Once you installed Tasker, open the app and switch to the “TASKS” tab.

Click on the + button to add a new Task and call it something of your liking like “PartyButton”.

Tasker Tasker

Tasks allow you to set a series of Actions, which control the music and lights. Once you have created the new Task the title should say “Taks Edit” and you can press + to add your first action. We will come back to this later as we need to set up access to the relevant parts first.

As a starting point you can also download my configuration file and import into Tasker, however you will need to do some customization based on the guidance below.

Setup Spotify control

This one took me the longest time to figure out as Spotify need authorization to let you control the playlist and volume. Make sure you have Spotify subscription or get it from somewhere.

Quick note on a simpler solution: The advantage of having access to the Spotify Web API is that you can also control volume and control Spotify for whichever device is playing the music. If your phone is playing on the bluetooth direclty, you can use Android Intents to play a playlist without the API. You simply send a ‘MEDIA_PLAY_FROM_SEARCH’ intent with the right user and playlist (more on this below).

To get control over your playlist, we need to follow the Authorization Code flow in the Authorization Guide of the Spotify API to authorize your personal account only once and then use the tokens we get to get access each time.

spotify authentication

Looks complicated, right? Worry not, I will go through it step-by-step.

First

To authorize our Tasker setup to control your spotify you need to set up a new Client on the Spotify Developer Dashboard. Click on “Create a Client ID” and put in information of your choice.

Once the Client is created you can open it and will see a Client ID.

When you click on “Show Client Secret” also a Secret ID.

Keep those at hand, as we will need them next.

Second

We will use the Client ID and Secret ID to get an initial Code from Spotify (see this step in the API guidance).

To do this we need to send a HTTP GET request to the Spotify API. The easiest way to do this is to open up a URL in Chrome and capture the content that was send back.

This URL will send authorization request to Spotify asking for the permission “user-modify-playback-state” and will ask you for permission to access your account. If you are not logged in to Spotify, you will need to log in first. The redirect_uri that is included is the URL to which the code will be send back to. I setup a script on my website that just dumps all the information on a website, making it easier for you to see exact the code. If you worry about sending this information to my side (I do not log it), it misses your secret key, so should not be sensitive.If you don’t like to use this redirect_uri you can also open the Developer Console in Chrome by opening up a new tab and pressing F12 when in Chrome.

URL to copy:

https://accounts.spotify.com/authorize?client_id=[YOUR-CLIENT-ID]&response_type=code&redirect_uri=http%3A%2F%2Fjohannes-friedrich.com%2FOLD%2Fspot.php&scope=user-modify-playback-state&state=34fFs29kd09

Spotify API

The response will contain a code that you can either see on the screen if you used my URL or you can see under the Network tab by clicking on ‘authorize?..’ and looking for the Response Headers. Copy the code.

Third

Now we will get the actual access token that will allow you to manipulate your playlist and volume though the web API (see this step in the API guidance).

You will need to first create a BASE64 encoding of client id:secret id (with a colon in between) from the first Spotify step. You can copying both IDs (with colon) on this site and pressing >ENCODE<. Copy the result

We will then create a HTTP POST message that sends the code from step 2 your BASE64 encoded string and gets back a Access Token and Refresh Token.

I am using Postman to create the POST. After you installed it you can copy the following URL with the body and headers into it:

https://accounts.spotify.com/api/token

Body: (application/x-www-form-urlencoded)

grant_type: user-modify-playback-state

code: [code]

redirect_uri: https://johannes-friedrich.com/OLD/spot.php (needs to be the same as above)

Header: Authorization: Basic [base64 encoded client_id:client_secret]

This will respond with a JSON object that will look like this:

{

"access_token": [STRING],

"token_type": "Bearer",

"expires_in": 3600,

"refresh_token": [STRING],

"scope": "user-modify-playback-state"

}

The access_token is what you need to send to control your spotify. However as it is set to expire in 60 min, you will need the refresh_token to get a new access_token each time.

Final code in Tasker to control Spotify

We did all this work just to get this refresh_token!

Now we can go back into Tasker set it up that each time it will get a new access_token with the refresh_token and we use that access_token to control spotify (see step 3 in the API documentation).

In Tasker press the + button to add a new Action. Search for “Java” and select JavaScriptlet.

You can then copy-paste the code below into the code section. The first request will get a new access_token and store it in a global variable.

// Get new access_token

var url = "https://accounts.spotify.com/api/token";

var method = "POST";

var xhttp = new XMLHttpRequest();

xhttp.open( method, url, false);

xhttp.setRequestHeader("Accept", "application/json");

xhttp.setRequestHeader('Content-type', 'application/x-www-form-urlencoded');

xhttp.setRequestHeader("Authorization", "Basic ODAzNWUxZWFiYTk0NDZjM2EzZTY1OGVmODUzNDNmOTc6ZDJjNmJiYjcwMzc0NDY0ZjhmOTg5MzM2NDUzMDVkNGY=");

xhttp.send("refresh_token=AQBYVgDTj8hmYXEBpdAabqprTMD8cZ3y6KoxjifQJniI7KNDau86elZnKuZTbnS43EnB8cjvHA1LsR9cTjVczZkK_DOvMs5cwX8hmupDE_1vn-ExZu8EKzYTMo9ZZ_ISj6fifQ&grant_type=refresh_token");

var response = JSON.parse(xhttp.responseText);

//flash(response.access_token);

setGlobal('%Access_token', response.access_token);

Then we can send different types of requests to Spotify.

Setting the volume:

// Set volume to low-level

var url = "https://api.spotify.com/v1/me/player/volume?volume_percent=6";

var method = "PUT";

var xhttp = new XMLHttpRequest();

xhttp.open( method, url, false );

xhttp.setRequestHeader("Accept", "application/json");

xhttp.setRequestHeader("Content-Type", "application/json");

xhttp.setRequestHeader("Authorization", "Bearer "+ global('%Access_token'));

xhttp.send(); //if method was "POST", put info in the () here

//flash(xhttp.responseText);

Play a certain playlist (containing the song you want to play). This one required you to specify a user and playlist. User is obviously your username. To get the playlist link you create a new playlist in your desktop Spotify application, then you right click on the playlist > “Share” > “Copy Spotify URI”. Paste the link somewhere and replace yoru user and playlist in the code below. The current code below plays “Turn Down for What”.

var url = "https://api.spotify.com/v1/me/player/play";

var method = "PUT";

var xhttp = new XMLHttpRequest();

xhttp.open( method, url, false );

xhttp.setRequestHeader("Accept", "application/json");

xhttp.setRequestHeader("Content-Type", "application/json");

xhttp.setRequestHeader("Authorization", "Bearer BQBwL1BQnqzloyQBQ5qQ7HVUcKzdFjUQD-XvSOnxKJFsYGv47e6BvFTxrKWRi5y4nltx7MHVHl5CJ_ImWnoYvgFV0iCZc2E-nRG1_Rl8-pdyIxBLy6fDv-SUmFQ-Ow2vtAoIqiJ6DNb1vR4Cs-2_9l7abHsg");

xhttp.send("{\"context_uri\":\"spotify:user:northwood23:playlist:4Iwf1DROS5tMrGCiHh6f7S\",\"offset\":{\"position\":0},\"position_ms\":20000}");

This should be all you need to get your Spotify nicely setup. For my setup I am turning down the volume at the start of the song, and then slowly cranking it up unit the main beat drops. See the more detailed setup at the end of the blog.

Setup Roku control

This configuration is in case you have a Roku that connects to your speakers. I find that convenient, as our Roku is always on and connected to our speakers and therefore avoids further manual steps to set up the audio.

For this configuration you need to be in the same wifi network as your Roku and will need to find out it’s IP. On your Roku go “Settings” > “Wi-Fi” > “Your network name” and write down the number next to IP. For me the number is “192.168.0.10”.

You can now send a request to the Roku to play a certain song with so-called “Deep Links”. It works similarly to above, go to your Spotify desktop application, right click on a song > “Share” > “Copy Spotify URI”. You will need to URL encode the URI and then copy it in the coe below after contentId.

// Start song on Roku Spotify app with contentID, will take about 8 seconds

var url = "http://192.168.0.10:8060/launch/19977?contentId=spotify%3Atrack%3A67awxiNHNyjMXhVgsHuIrs";

var method = "POST";

var xhttp = new XMLHttpRequest();

xhttp.open( method, url, false);

xhttp.send(); //if method was "POST", put info in the () here

//flash(xhttp.responseText);

Trigger IFTTT from Tasker

As mentioned Tasker does not have integration with most smart devices, so we need IFTTT.

After you opened IFTTT go to “My Applets” > “+” > “this” > Search “Webhooks” > “Webhooks” > “Receive a web request” > choose “Event name” > “Create Trigger” >“that” > Select your smart device.

Depending on the smart device you need to have some custom setup. In my case, I have a Wemo Mini, installed the Wemo App and connected it to IFTTT via Wemo App. You should then be able to select that smart device in the “that” section of your setup.

Now we have a webhook. To trigger that webook we will need to open a URL. You can find your personal webhook URL by going on the IFTTT site: https://ifttt.com/maker_webhooks

Click on documentation and copy the link that will look like this with the key being your personal key.

https://maker.ifttt.com/trigger/[event]/with/key/[key]

Now you can simply add an “HTTP GET” Action in Tasker with the link above and adding your trigger name. For me this would look like this.

https://maker.ifttt.com/trigger/wemoon/with/key/[mykey]

That’s it. Now you can create a webhook for each smart device you have.

Grab the Amazon Dash Button notification

https://www.reddit.com/r/tasker/comments/3f0ebb/how_to_using_a_bluetooth_remote_to_launch_tasker/

Finally, we want to trigger the Task that we have setup in Tasker when we press the Dash Button.

This is possible with a little hack when you connect to the Dash button, but do not finish its setup. Install and open the Amazon Shopping app. Open up the menu > “Your Account” > Dash Buttons “Set up a new device” > “Dash Button”. Press and hold the Dash Button for 6 seconds. Press “Connect”. Confirm the Wifi. When the setup gets to selecting a product, do close the setup with the x button and confirm the warning. You should now see the Dash Button under “Mange your Dash devices” with a warning that “you have to choose an item to complete setup”. Click on “Notification Settings” deactivate all notifications except the Dash Button one. The Dash Button setup is finished.

If everything is right, when you push the Dash Button, a notification should show up that “Your [..] Dash Button is almost ready for use”.

Next, install Notification listener and open the app to give it permission to access to your Android notifications. This should be prompted automatically when you start the app the first time.

Once you given the listener the right permissions go back to Tasker select the “Profiles” tab > “+” > “Events” > Search “Notification”> “Notification Listener” > “Configuration” > “Apps” > “Amazon” > “✓” > “✓”

You can now go back to the Profile tab and select your party button Task to be triggered when the Amazon notification is detected.

Notification Listener Tasker

There you have it. You should now be able to press the Button, see a notification on your phone pop up and have the party button task started. 

How to Visualize Key Climate Change Question in 7 Interactive Emissions Charts
150 150 johannes

Utilizing data visualization can be one of the best tools for compelling communication in an organization, especially in the field of climate change.
This blog illustrates how to 1) answer a common or interesting climate change questions 2) with an engaging, intuitive and interactive visual. I will also 3) explain why each visual works and 4) how to build your own.
This series of visualizations below may provide some inspiration how to combine data and interactive charts techniques to provide engaging answers.
Most visuals in this blog rely on data of the Climate Watch project, which I manage at the World Resources Institute. Disclaimer: This blog is written in a personal capacity and does represent only my personal views.

1) How has the climate changed since you were born?

Climate change has not just happened recently – we have been putting greenhouse gas emissions into the atmosphere for centuries now. The causal chain is simple: We emit greenhouse gases (mostly carbon dioxide, CO2), which increase their concentrations in the atmosphere, which in turn traps heat and has a warming effect on the climate.
To illustrate the point, the visual allows you to hover over your birthday below to see the how emissions, concentrations and global temperatures have changed since that year.

Why this visual?
Making a personal connection will help communicate that climate change is already happening now. Sometimes even old data, visualized in a personal, novel way way can help you get more attention and reach a much broader audience than just explaining it in writing.
The interactivity allows you to select your birth year quickly with just your cursor. Though the up and down movement of the chart is unnecessary, it makes the chart a bit more interesting than just having a standard line chart.

How is it done?
The visual is build in ObservableHQ and you can make a copy or download it.
Note that the chart shows three different data types on three different scales. That is why it does not have a labeled y-axis. If you hover over a year it will show you the increase of these three variables from your selected year at the top right. One confusion that might come up is for temperature, where the chart shows increase in annual average temperature compared to the average across the years 1951-1980. This means that the 1900 averge was 0.2 degC below the 1951-1980 average (which the number right above the green dots indicates). In turn the increase from the 1951-1980 average was 0.92 degC. However the number on on top show the increase since on specific year, which would for example be 1.1 degC compared to 1900 (0.2 + 0.9).

2) Who are the largest global emitters?

This question is more difficult than it seems. While total emissions matter, we need to consider many different other factors as well if we compare countries. Let’s look at this from a few different perspectives:

2a) Who are the top 10 total emitters?
What matters to the climate and how much temperature will increase is how much we emit in total globally.
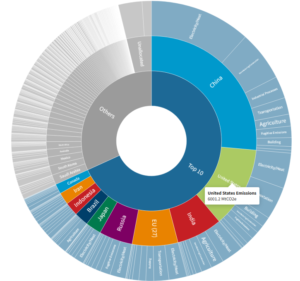
The top 10 emitters contribute nearly two-thirds of global greenhouse gas emissions. Click on the chart below to zoom into a country and see what the main emitting sectors are.


Why this visual?
This Sunburst chart is basically a hierarchical pie chart. A normal pie chart could also do it, but wouldn’t that be kind of boring? The advantage of using this chart is that you can more clearly highlight the 10 emitters as well as provide one more level of granularity – the emitting sectors.
Also note in this chart that these numbers can vary depending on whether you group the European Union as one country (like done in this chart) and what sectors you include. For the chart above I am excluding land-use change and forestry because those values can be negative (a carbon sink) and cause problems if you want to visualize percentages. It also excludes bunker fuels, which are international aviation & international shipping and are usually not included in country totals.
Sunburst charts work with hierarchical data that add up to a percentage total. This is particularly useful for emissions, but also works with other information, like trade products categories or causes of death. Another advantage is that you can even flip the categories, to show the data first by sectors, then by gas. For more on this, see question 4 below.

How is it done?
This sunburst visual is created in flourish.studio and can be cloned there. You can also see a D3 version of this chart here.
You will just need the most granular type of data. So in the chart above we are using a table that contains all sectoral emissions by country and totals are calculated automatically.

2b) Who are the top emitters per capita and historically?
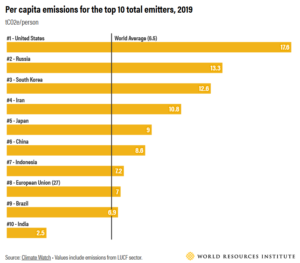
There are several different perspectives when it comes to comparing countries, since they have different populations and a different history. Let’s look at how a the (latest total) top 10 emitters compare based on their total emissions, per capita (per person) emissions and cumulative emissions since 1850 (adding up each year’s emissions).


Why this visual?
The question of responsibility for climate change is common and a holistic account must be taken to achieve greatest honesty and not blame a single country. The reality is that there are many indicators that can be used to show responsibility or what’s ‘fair’. There are whole tools that just aim to visualize all of the different indicators related to ‘equity in climate change. It’s best for you to know that there is not just one simple answer. Sometimes highlighting how different perspectives emerge depending on the data and visualizations can be helpful in providing a nuanced view.

How is it done?
They are three separate visualizations based on flourish.studio and Climate Watch data: Total emissions numbers, per capita numbers, and calculated cumulative numbers adding up annual emissions starting in 1850.

3) How have the top emitters changed?

The charts below show the trends for the top emitters over the last 56 years. Note that the y-axis has a different scale on each chart, so they only show relative change.


We can see that some countries were already able to peak their emissions (albeit on a high level) and many low emissions countries are catching up with the higher emitters. Refer back to question 2 to see how their emissions look relative to one another.

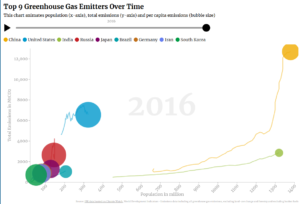
Let’s look at another picture. The chart below shows how the the (latest) top 10 emitters have changed their share of emissions over time. While the top 10 emitters have changed their emissions a lot in the last 100 years, the share of top 10 emitters has stayed mostly the same. The reason for this is that while the top emitters have increased their emissions a lot the rest of the world has also increased its share. The message stays the same, the top emitters need all pull together to reduce their emissions. Press play on the chart to see the changes from 1900 to 2016.


Why these visuals?
The first chart is commonly called ‘Small Multiples’ and can show comparative trends of different entities next to each other. The advantage is that you can show data that has different scales without overloading one single chart. Alternatively you could also use an index chart, similarly to the first one in this blog.
The second chart is a Treemap and is actually using the same hierarchical approach as the Sunburst, but also includes a timeline. You can use them interchangeably; I just introduced a Treemap here to show an alternative to the Sunburst.

How is it done?
Both charts work on flourish.studio. The the small-multiples chart uses time series of the largest emitters and the Treemap combines hierarchical data with time series.

A challenge you will face regularly is to have this data in the right table format, with years also being a column. Manipulating tables by turning rows into columns and vice versa is called “(un)pivot” (I have also heard the term “normalize” in the past, but this actually would refer to getting data into a common range, like 0 to 1). The goal in most cases is to only have one column that actually hold your main value (like emissions). In the example below, the table on the left mostly works, but the emission by years are distributed horizontally. The table on the right makes the year another column and has only one column for emissions.

You can pivot data using Microsoft Excel and its Power Query functions. Of course there are also other, more open software that can do it, just try a Google search.

5) What is driving emissions?

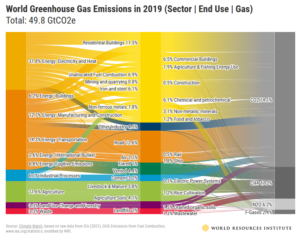
A few key sectors are responsible for an increase in emissions. The energy sector is still the single largest contributor, with nearly 75% of emissions. Within the energy sector the power sector and transportation make up most of the emissions, with both still on the rise. Outside of energy, industry and agriculture are also significant sources. Industry has doubled since 2000 to become the third largest emitting sector and agriculture has slowly risen by 13% since 2000.


Why this visual?
You might notice that the grouped-circle visual uses the same hierarchical data we have used before in question 2 and 3. This is to illustrate that data can be used to answer different questions depending how you structure and visualize it. Instead of having a country perspective this chart is using sectors as the first level and gases as the second level to show which economic sectors are the main drivers.

How is it done?
If you have prepared your data once you can easily use it for Sunburst, Treemap and Grouped-Circle visualizations. You can clone the the visual on flourish.studio and also change the chart into a Treemap or a Sunburst

Bonus question: Can you show me all this data in one chart?

Sure, we can also utilize Hans Roslings famous bubble chart to show you the different dimensions in one visualization. You can also explore the data further with the Google Public Data Explorer.


I hope this will give you some inspiration to enhance communication of climate change within your organization. If you have any questions or suggestions, feel free to leave a comment or write me an email and make sure you check out my work with the World Resources Institute.