How to Visualize Key Climate Change Question in 7 Interactive Emissions Charts
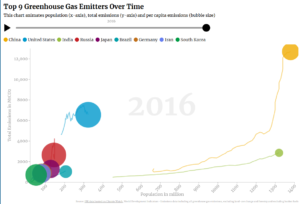
How to Visualize Key Climate Change Question in 7 Interactive Emissions Charts https://www.johannes-friedrich.com/wp-content/uploads/2019/12/7visuals-1024x698.png 1024 698 Johannes Friedrich https://www.johannes-friedrich.com/wp-content/uploads/2019/12/7visuals-1024x698.pngUtilizing data visualization can be one of the best tools for compelling communication in an organization, especially in the field of climate change. This blog illustrates how to 1) answer…
read more